01 / SYNTHETIC
Uptime and SSL
Check HTTP responses, TCP connectivity and DNS records. Get a warning before an SSL certificate expires and inspect your check history.
 TraceKong.
INFRASTRUCTURE & SERVICE MONITORING
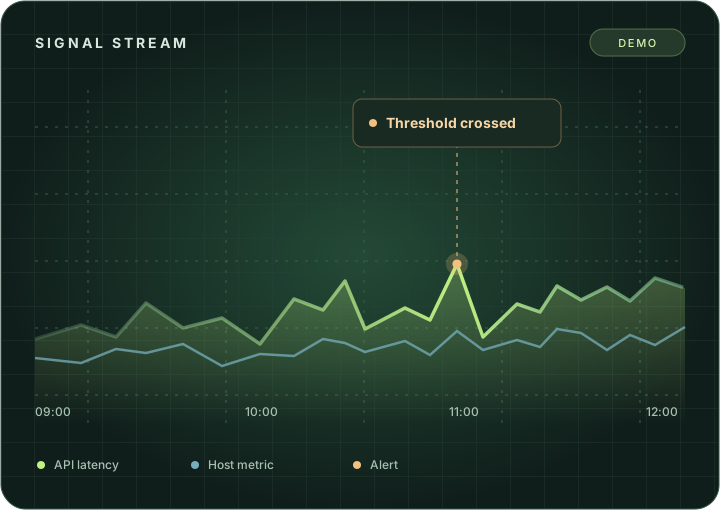
Monitor web services, API workflows, Windows and Linux hosts, and sending IPs in one workspace. Open the relevant measurement and incident when a threshold is crossed.
MONITORING MODULES
01 / SYNTHETIC
Check HTTP responses, TCP connectivity and DNS records. Get a warning before an SSL certificate expires and inspect your check history.
02 / SYNTHETIC
Run sign-in, authorization and API requests as one workflow. Pass a value to the next step and see where a check failed.
03 / INFRASTRUCTURE
Collect CPU, memory, disk, process and network measurements from agents. Set thresholds and notification channels per host.
04 / DELIVERABILITY
Check sending IPv4 addresses against DNS blocklists. Review listing changes and provider results over time.
MONITORING WORKFLOW
Add a target or connect a Windows or Linux agent.
Choose an expected response, resource threshold or notification channel.
Open the alert and compare it with earlier measurements.